When you want to know every week if the work still pays
How to run a weekly profit check: who is under target and who loses money
Each week, see which techs are under target and which clients cost more than they pay. Then reprice, fix time capture or plan a renewal talk.
See it
Browse
On this page
How to do it
Pick one slot a week and hold to it.
Late in the week works best. The target is five full days, so most techs read low early in the week. You need Time access at the edit or admin level to see every tech. The page says Showing: all technicians when you have it. Below that it shows only your own time. Profitability also needs Billing view permission.
Open the Time page for the week.
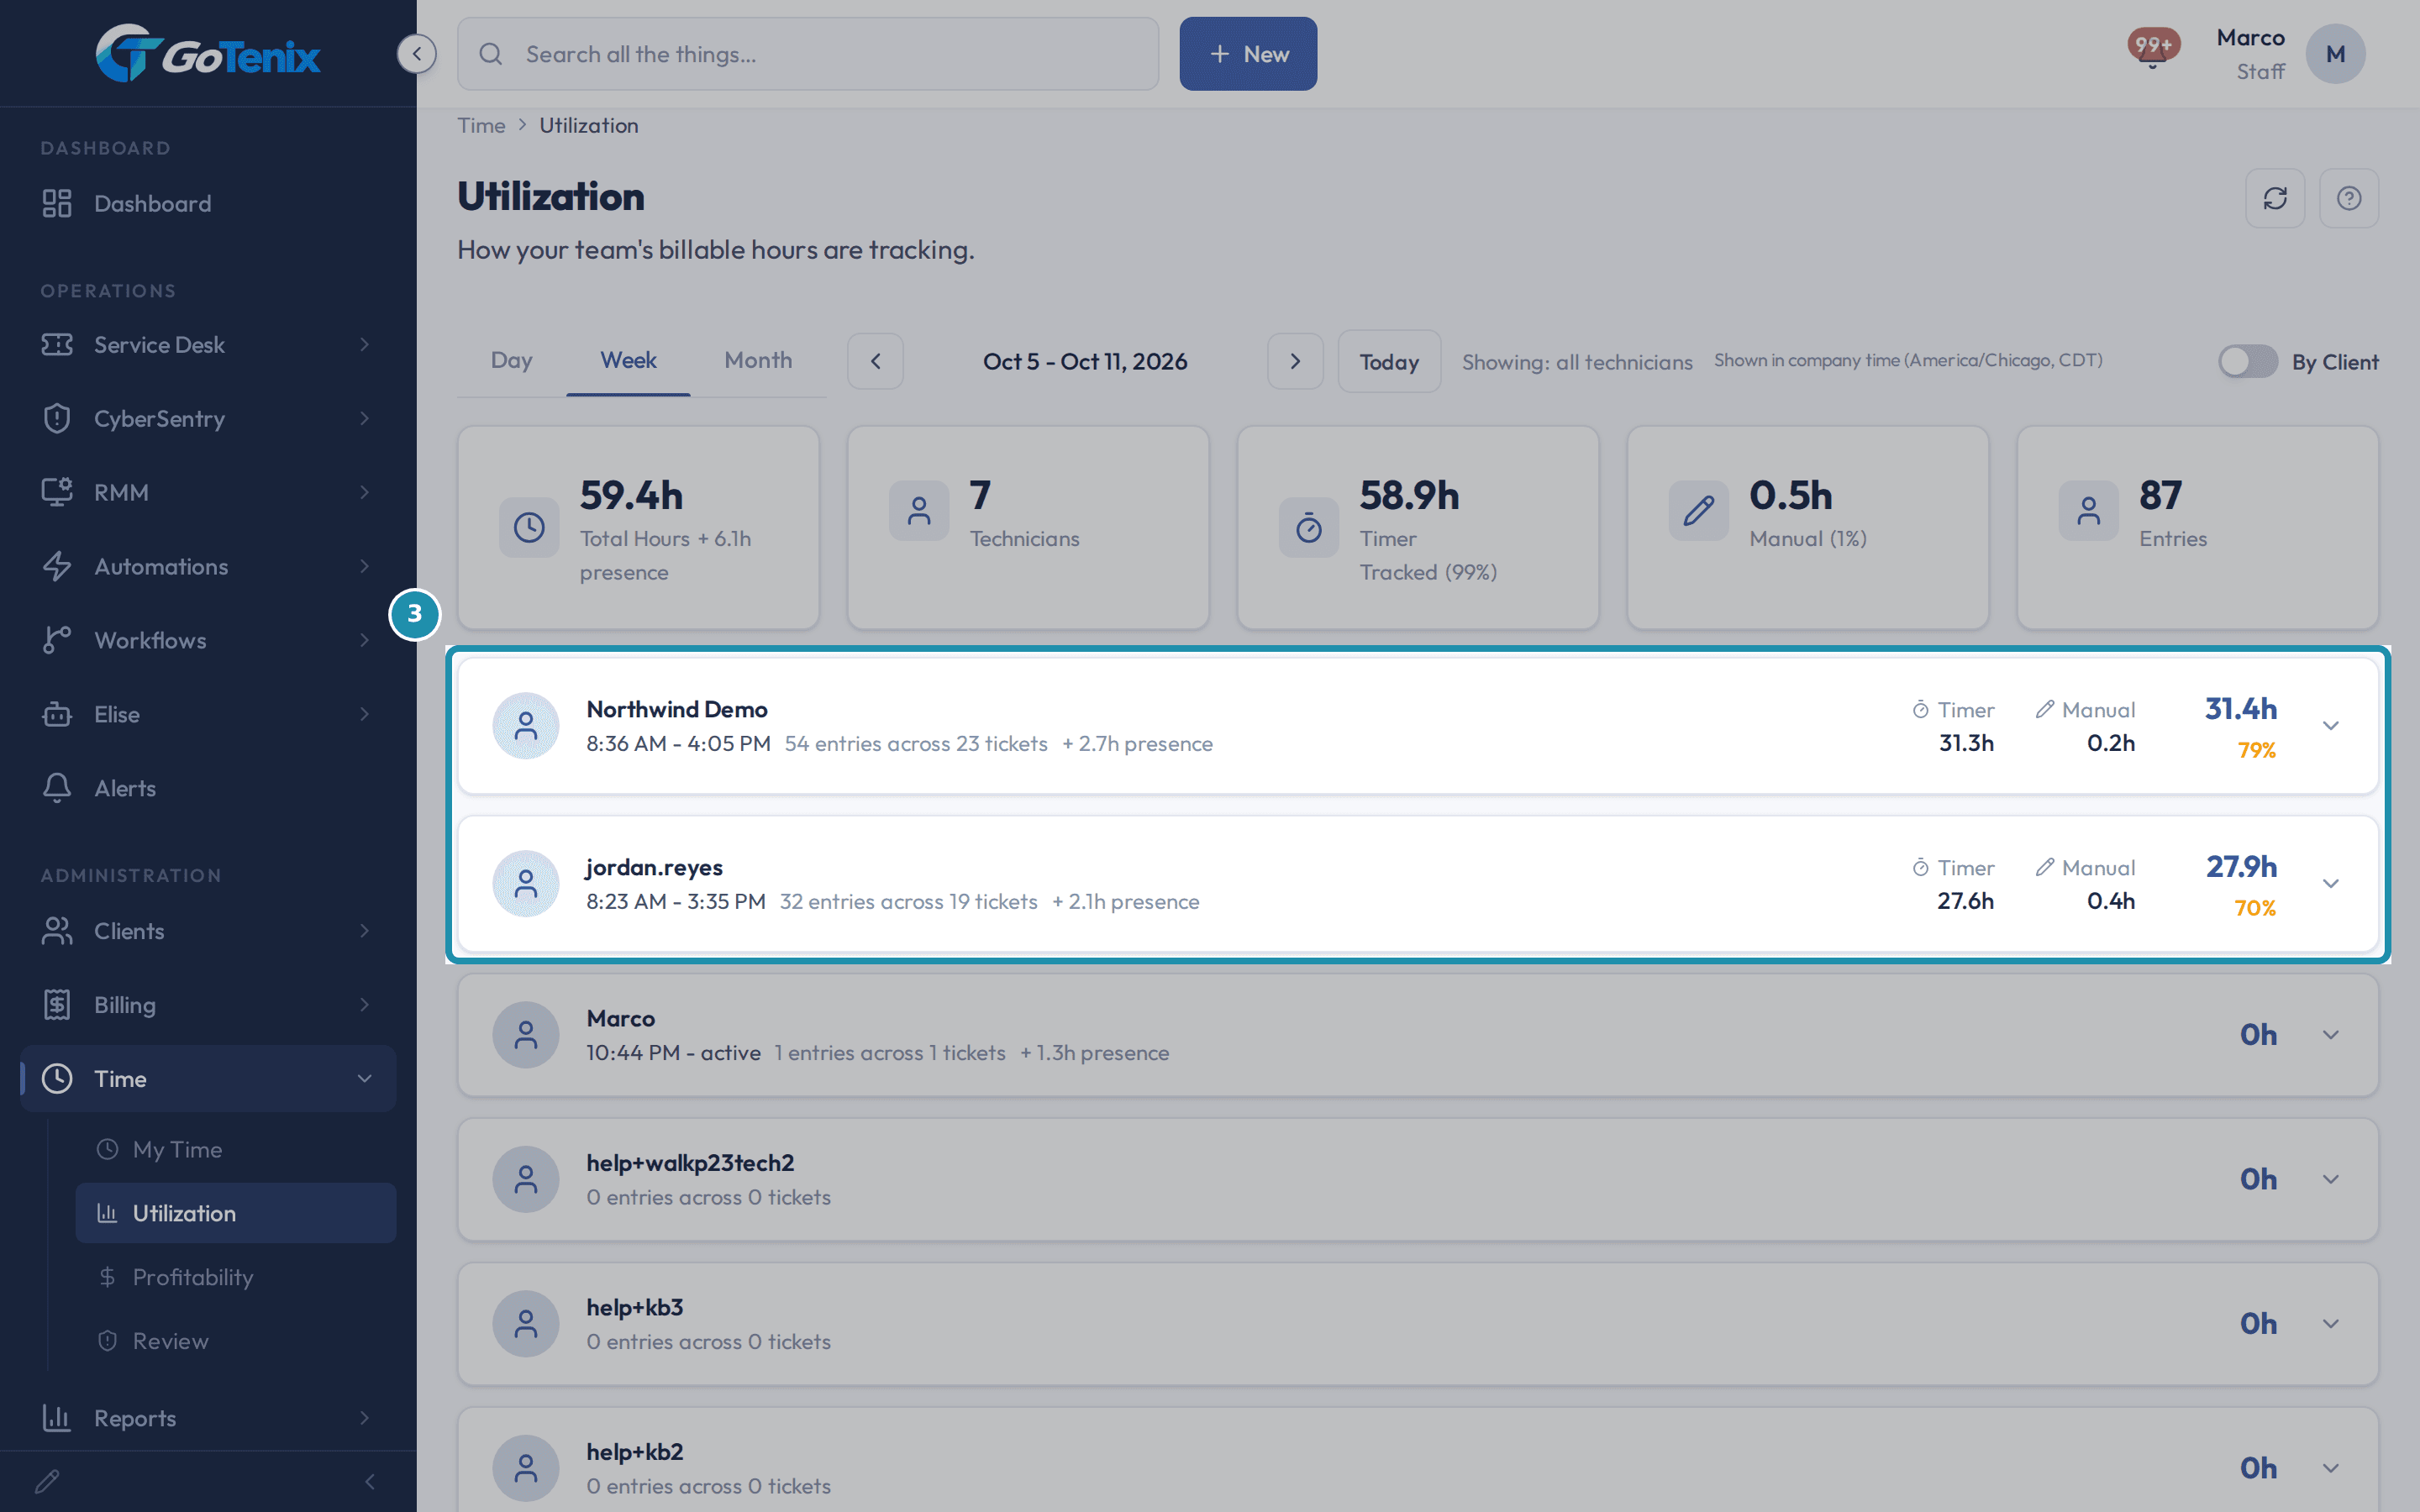
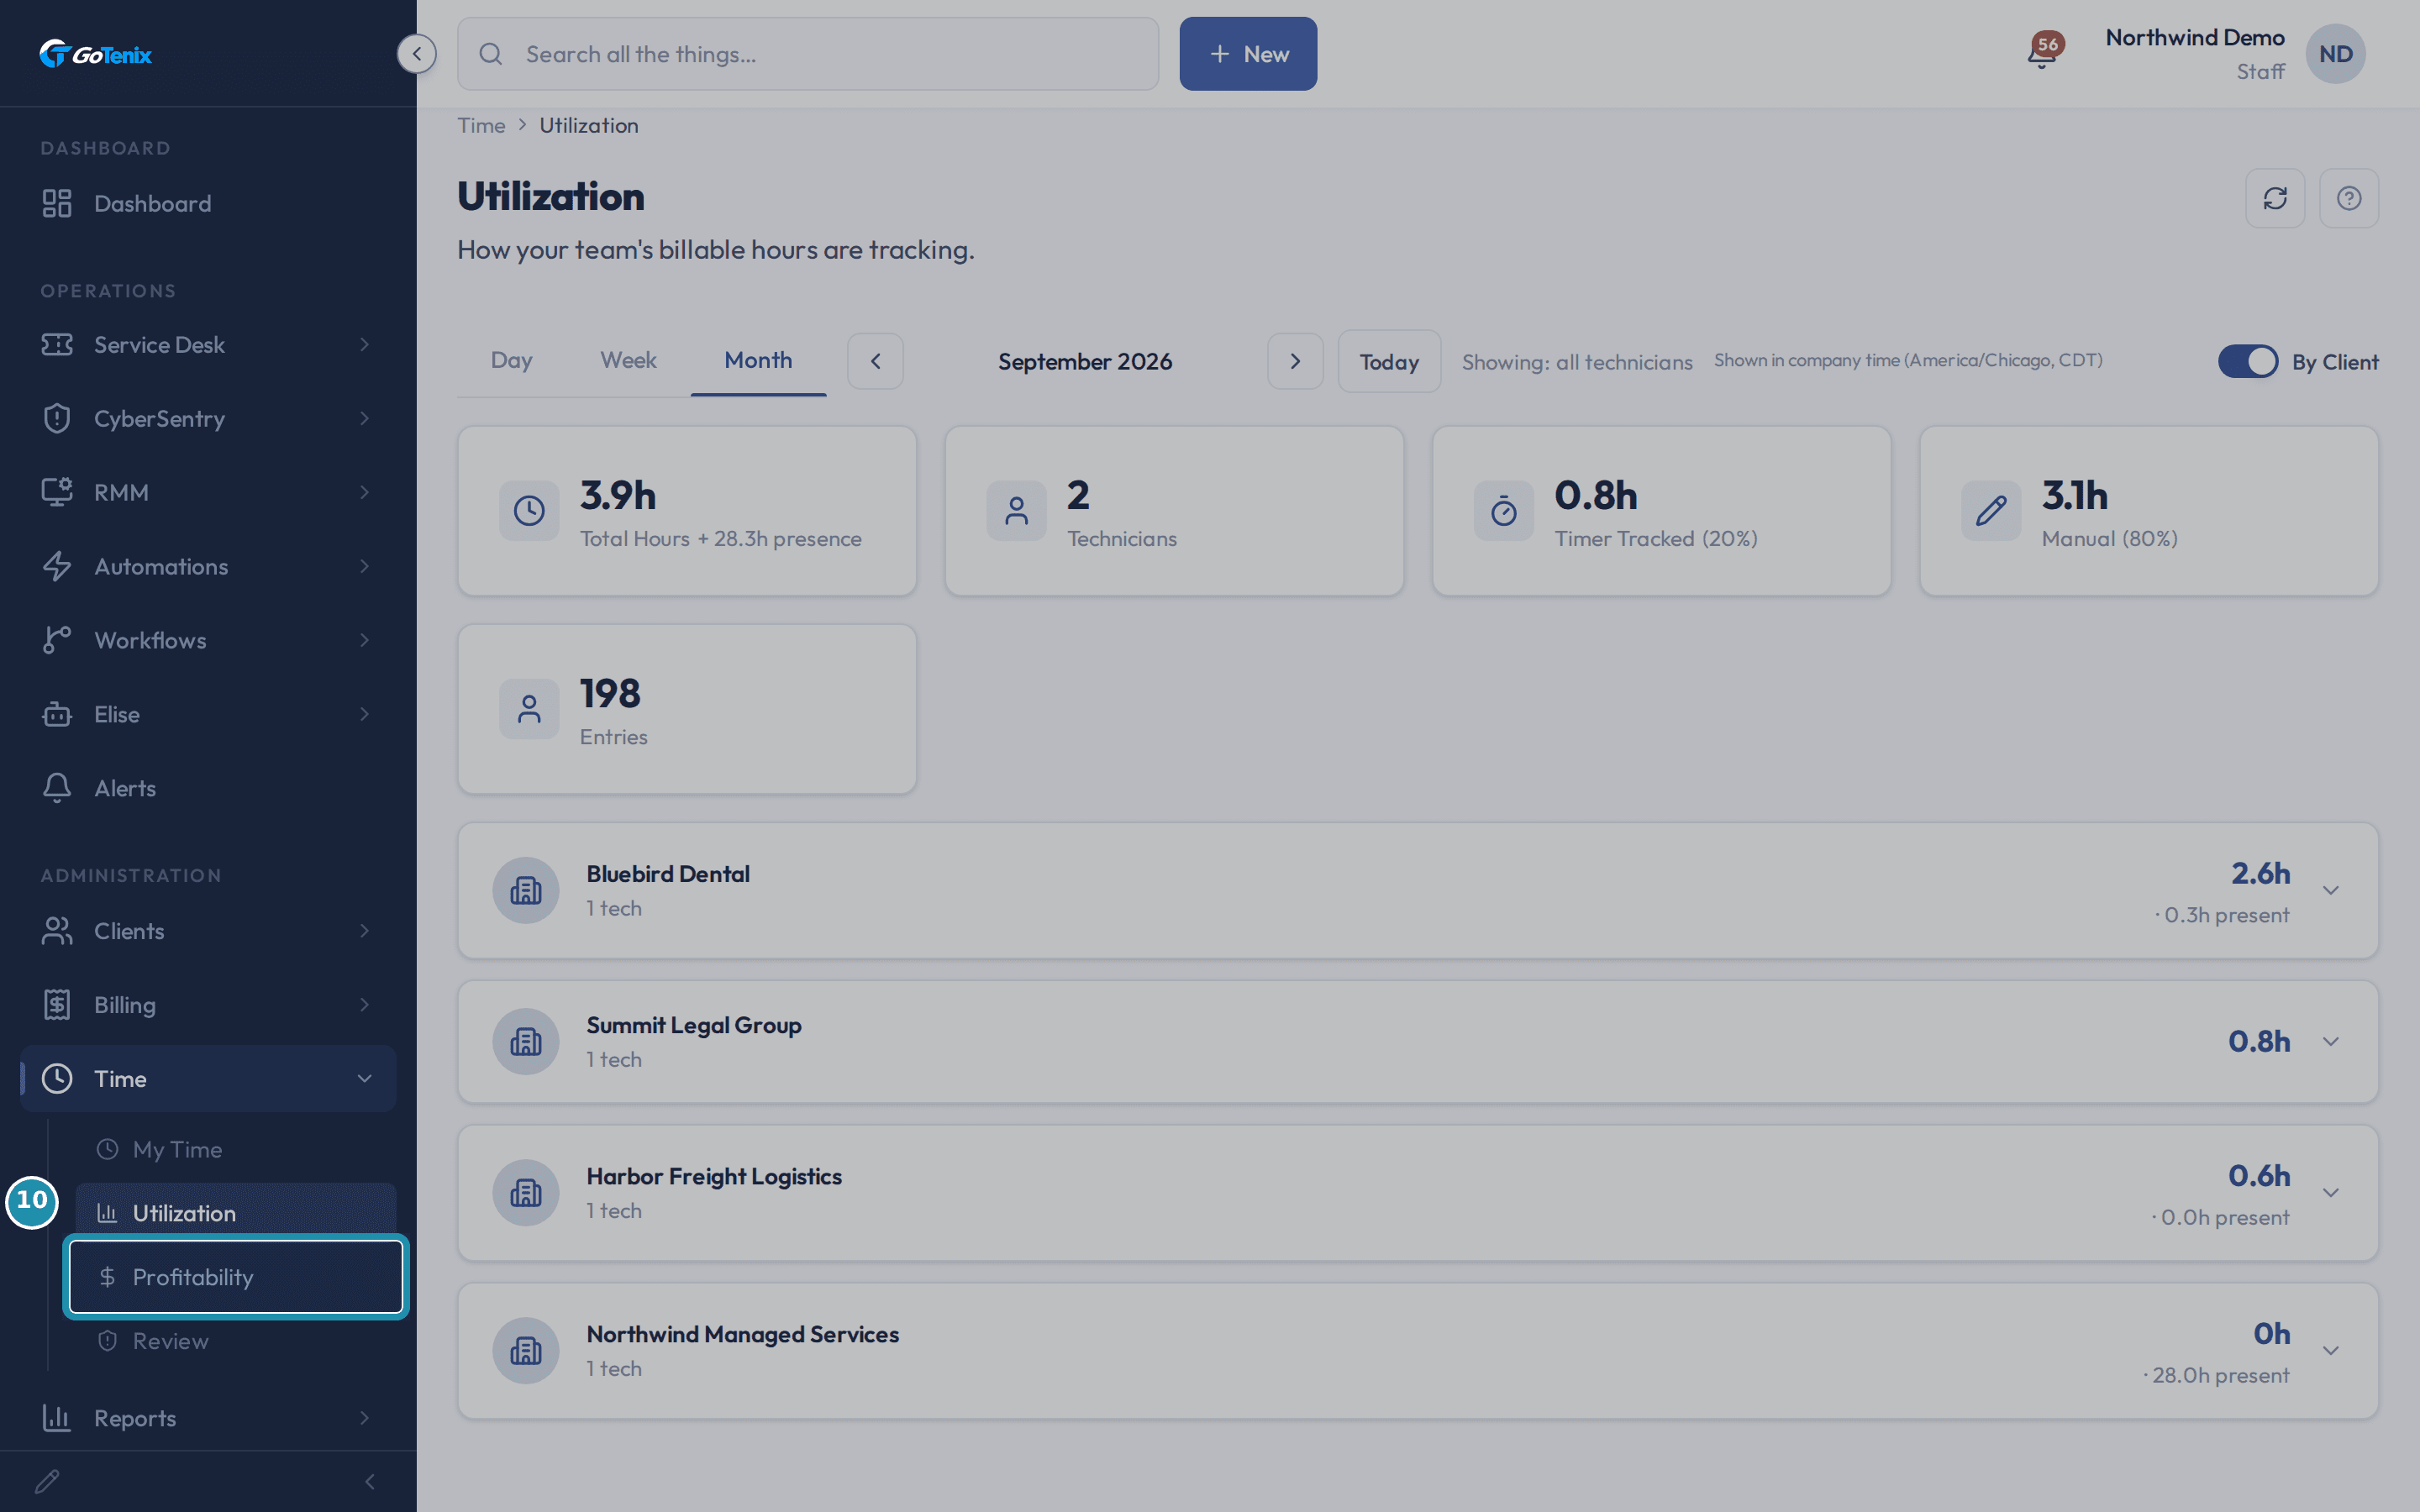
Under Time in the sidebar, click Utilization. Pick Week. You can also pick Day or Month. Use the arrows and Today to move between periods. The tiles show Total Hours (with presence beside it), Technicians, Timer Tracked, Manual and Entries.
Open the Time page for the week. Find who is under target.
Each tech has one line: first and last activity, entries across tickets, presence, Timer and Manual hours, a total, and a percentage. The percentage compares worked hours with the expected hours for the period. It is green from 80, amber from 50 and grey below 50. Grey is who to talk to. Presence, meaning idle time, breaks and time with a page open, shows beside worked time. It is never added into it.
Find who is under target. Check how the hours were captured.
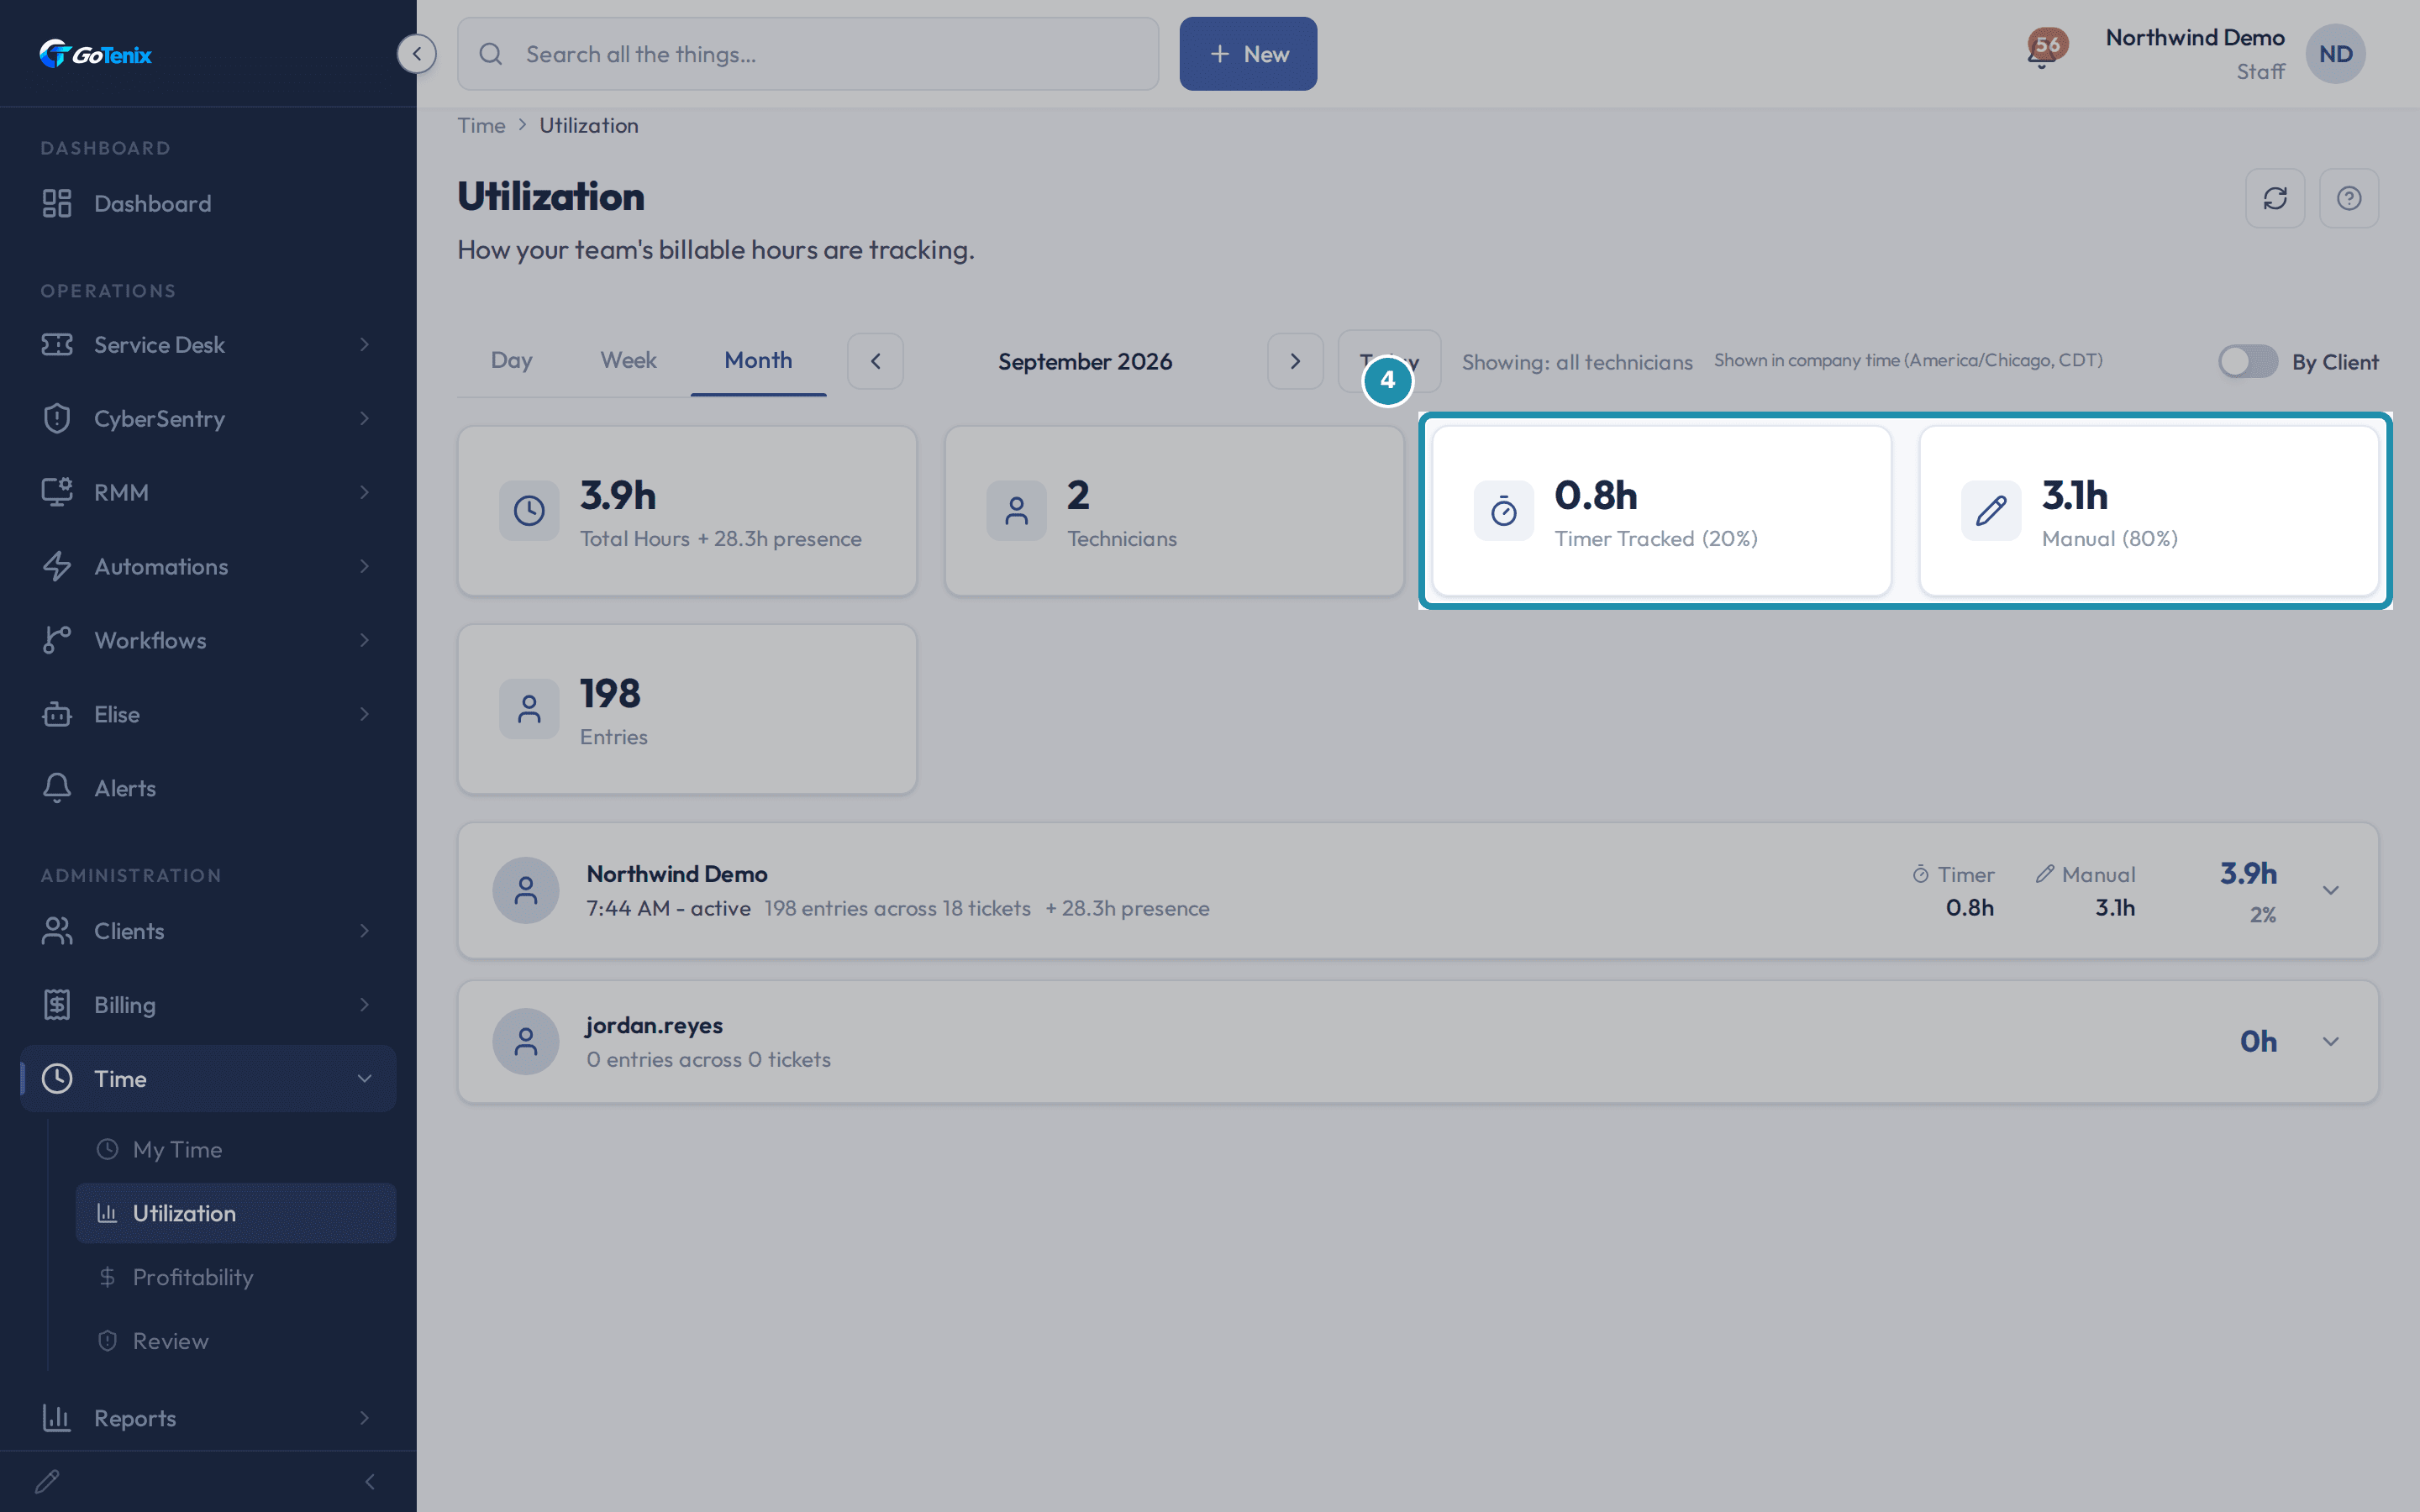
Timer Tracked and Manual show how the hours were captured. Manual is time someone typed in rather than the timer saw. Compare it with Timer Tracked before you judge a low number.
Check how the hours were captured. Open a tech's line to see where the hours went.
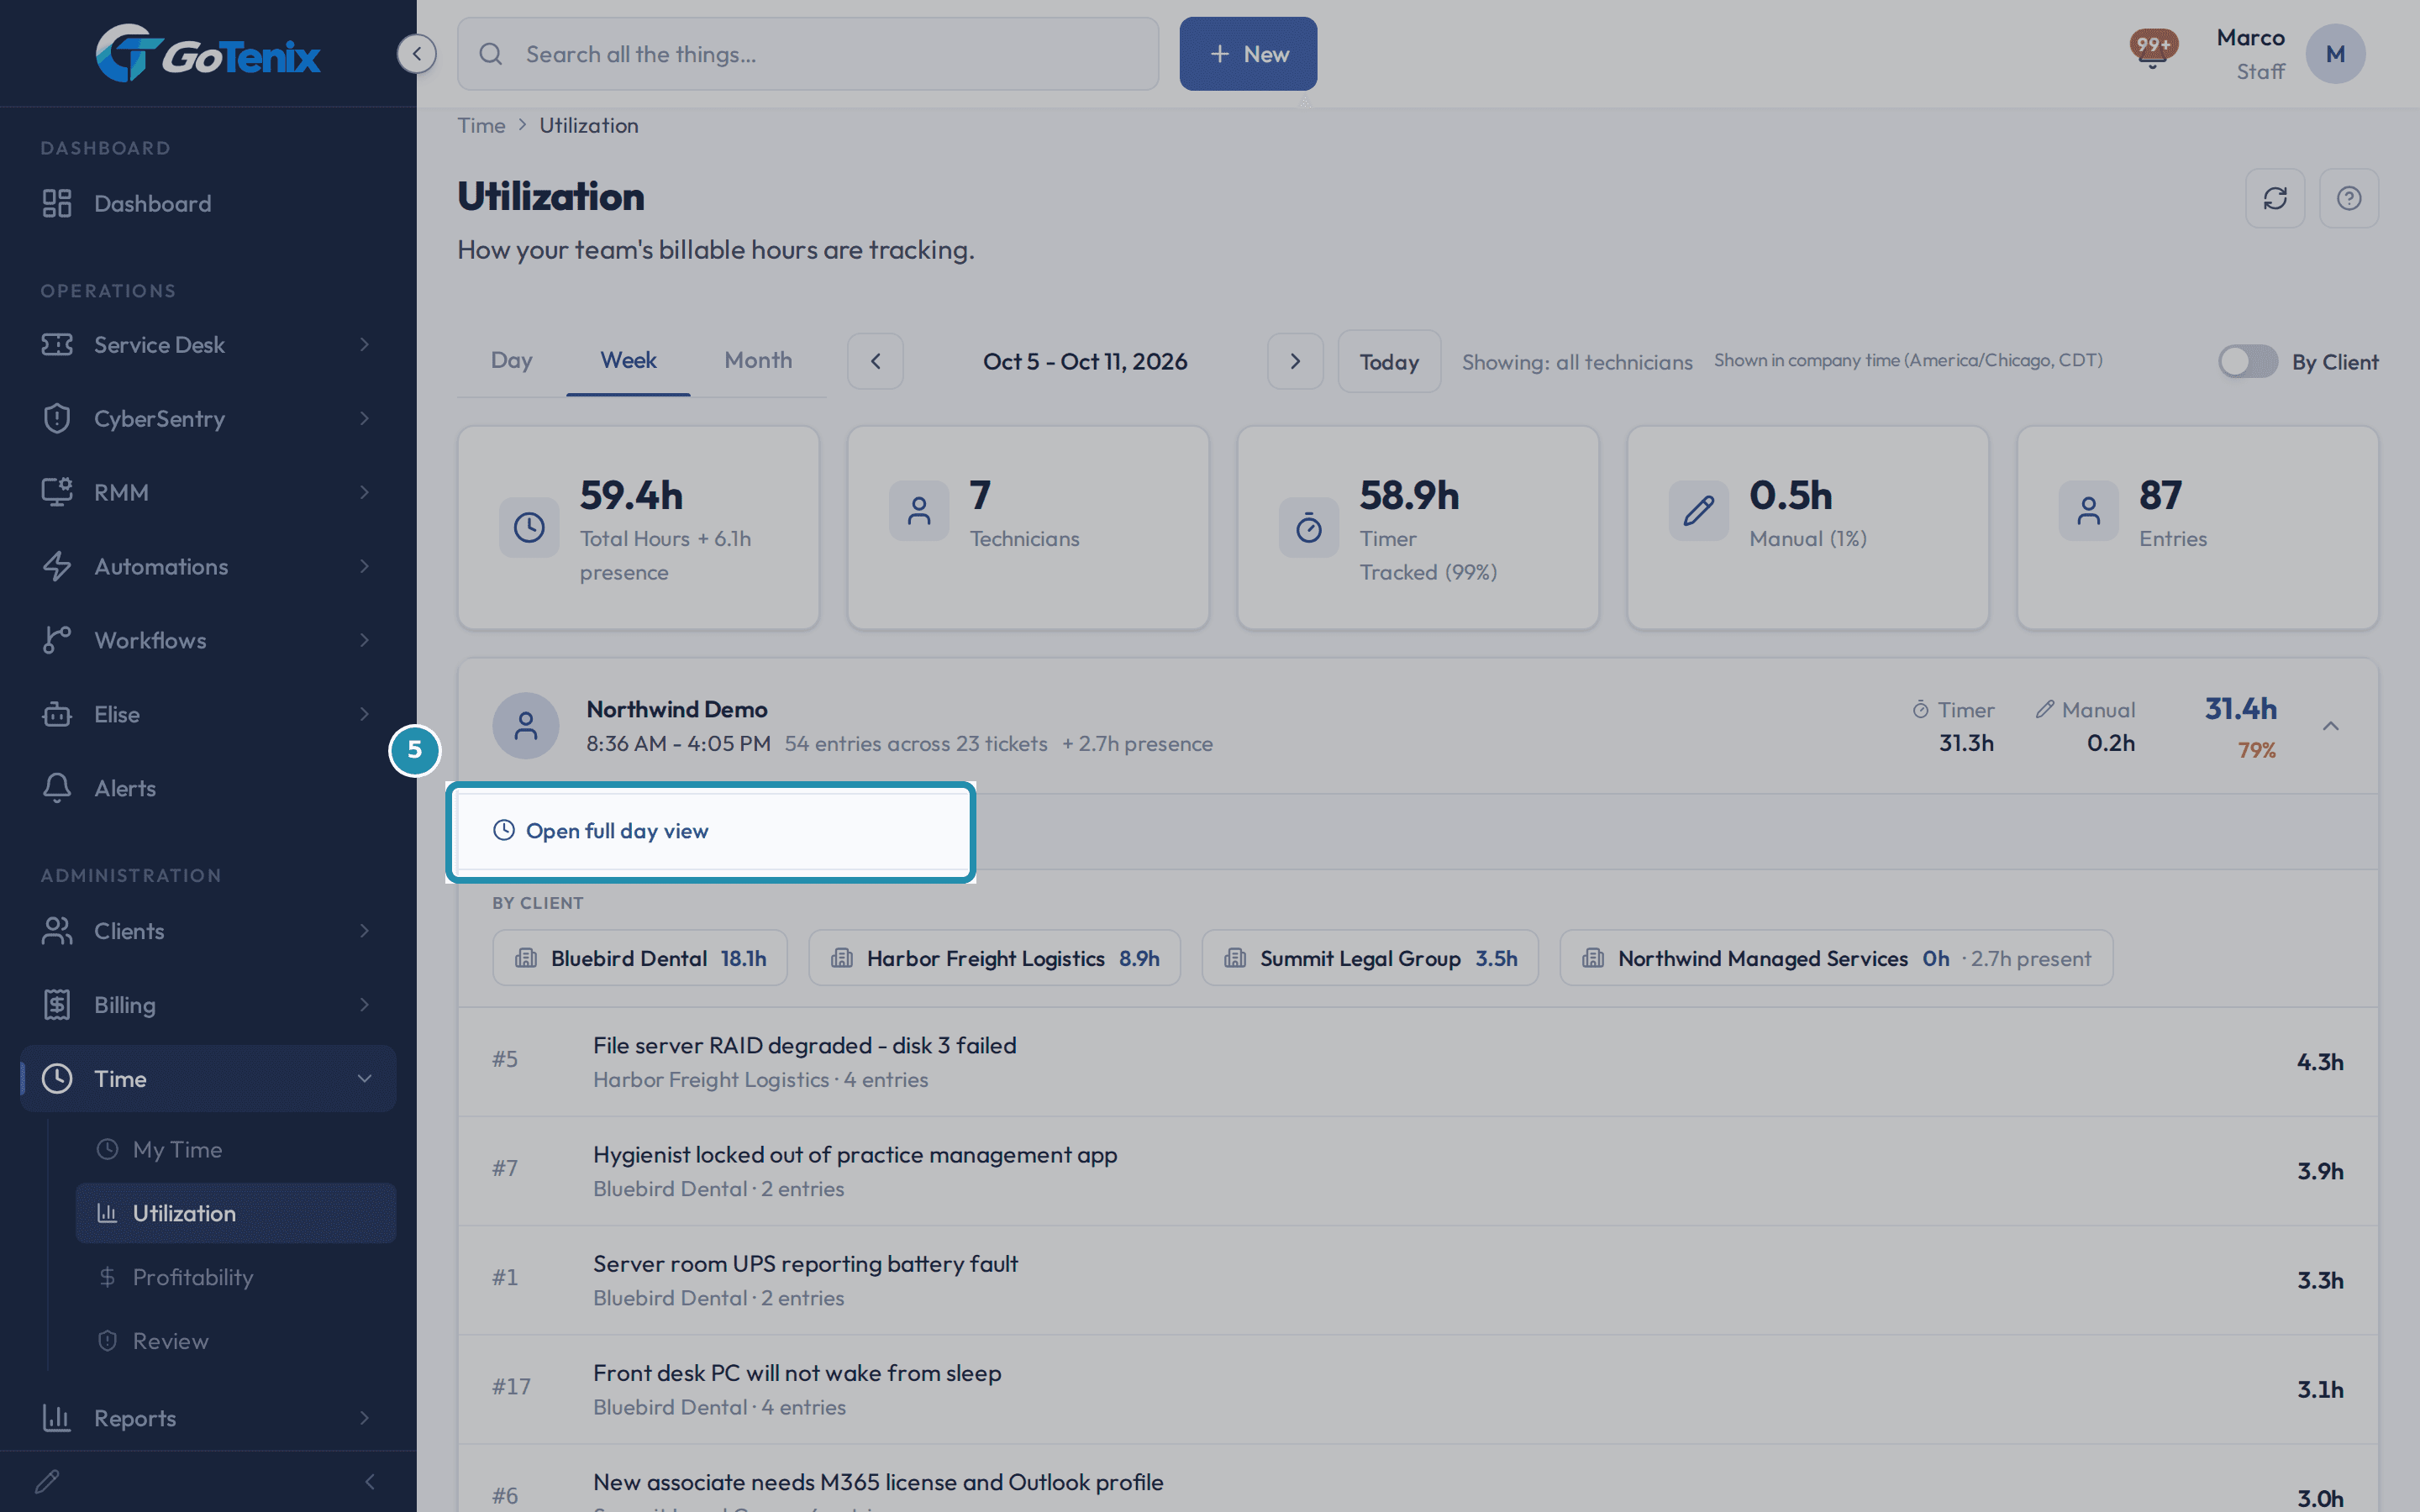
Click a tech's line. Open full day view shows that tech's day on My Time, By Client chips show where the hours went, and the ticket list shows each ticket with its client and minutes. Click a ticket to open it.
Open a tech's line to see where the hours went. Switch to By Client.
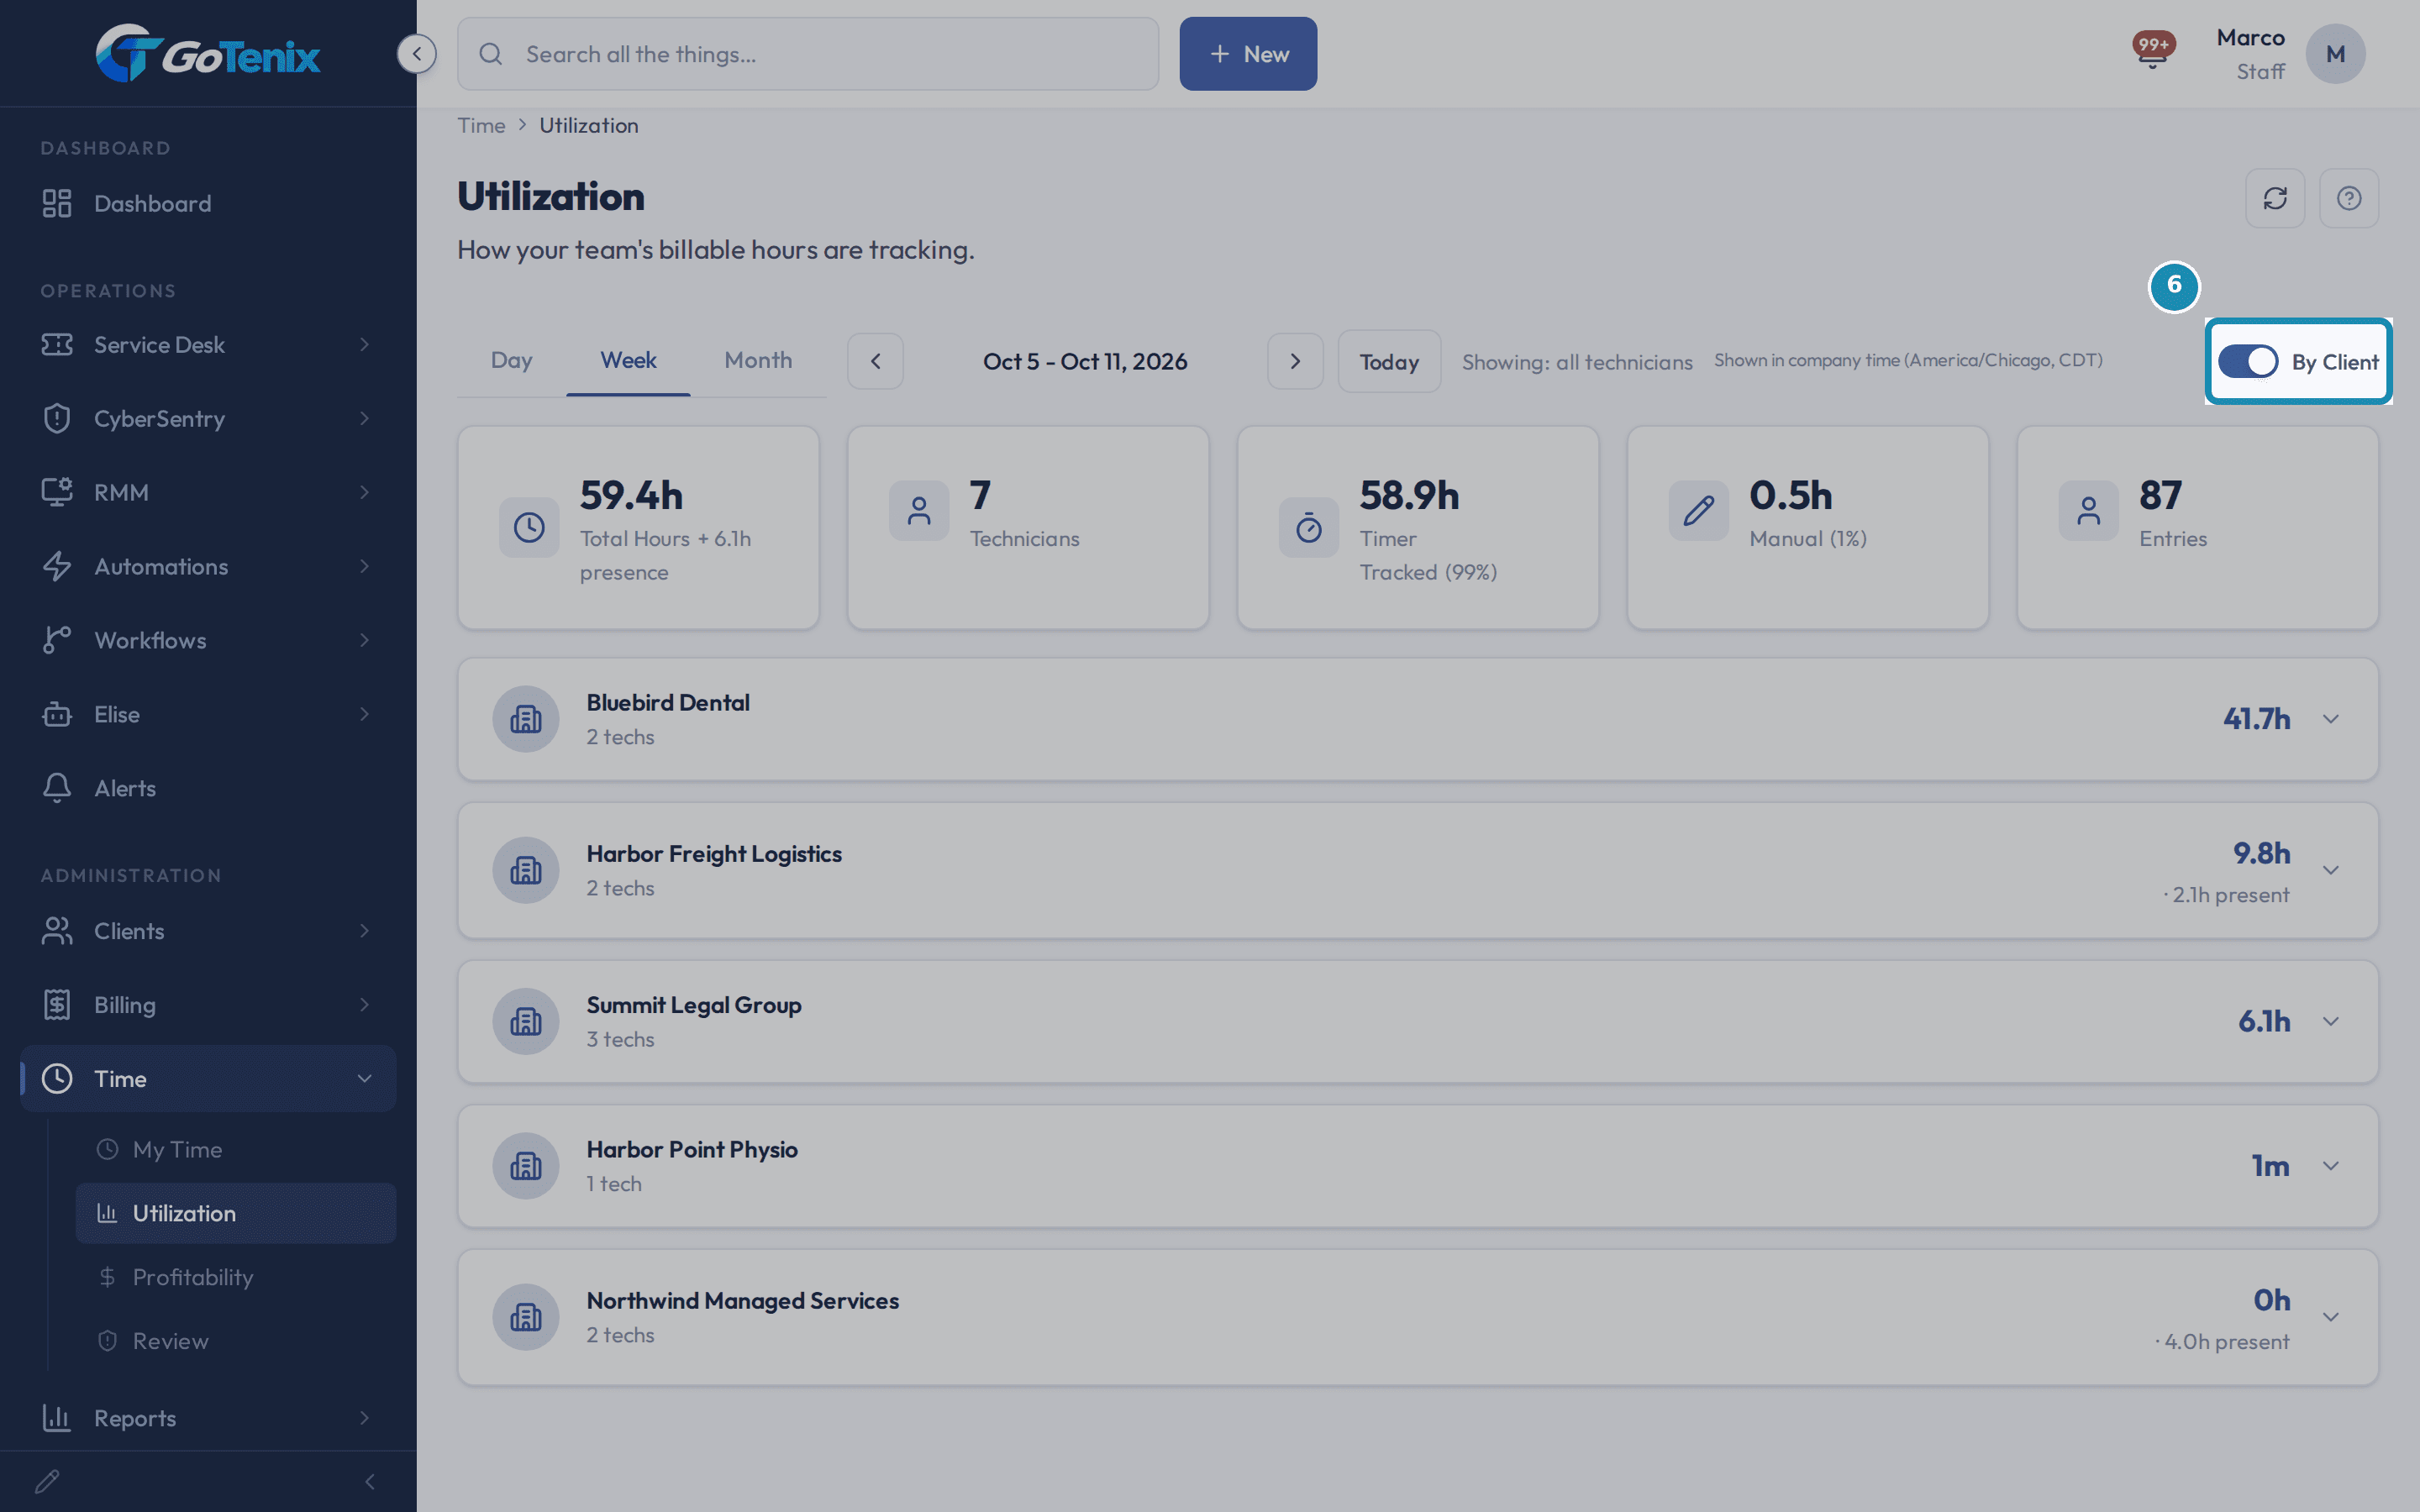
The By Client toggle regroups the same hours by client. Each client shows hours worked and, in small text, presence. A client with presence but almost no worked hours is a client your team was around without anyone declaring time to it. That is time nobody is billing.
Switch to By Client. Open the page that shows which client costs you money.
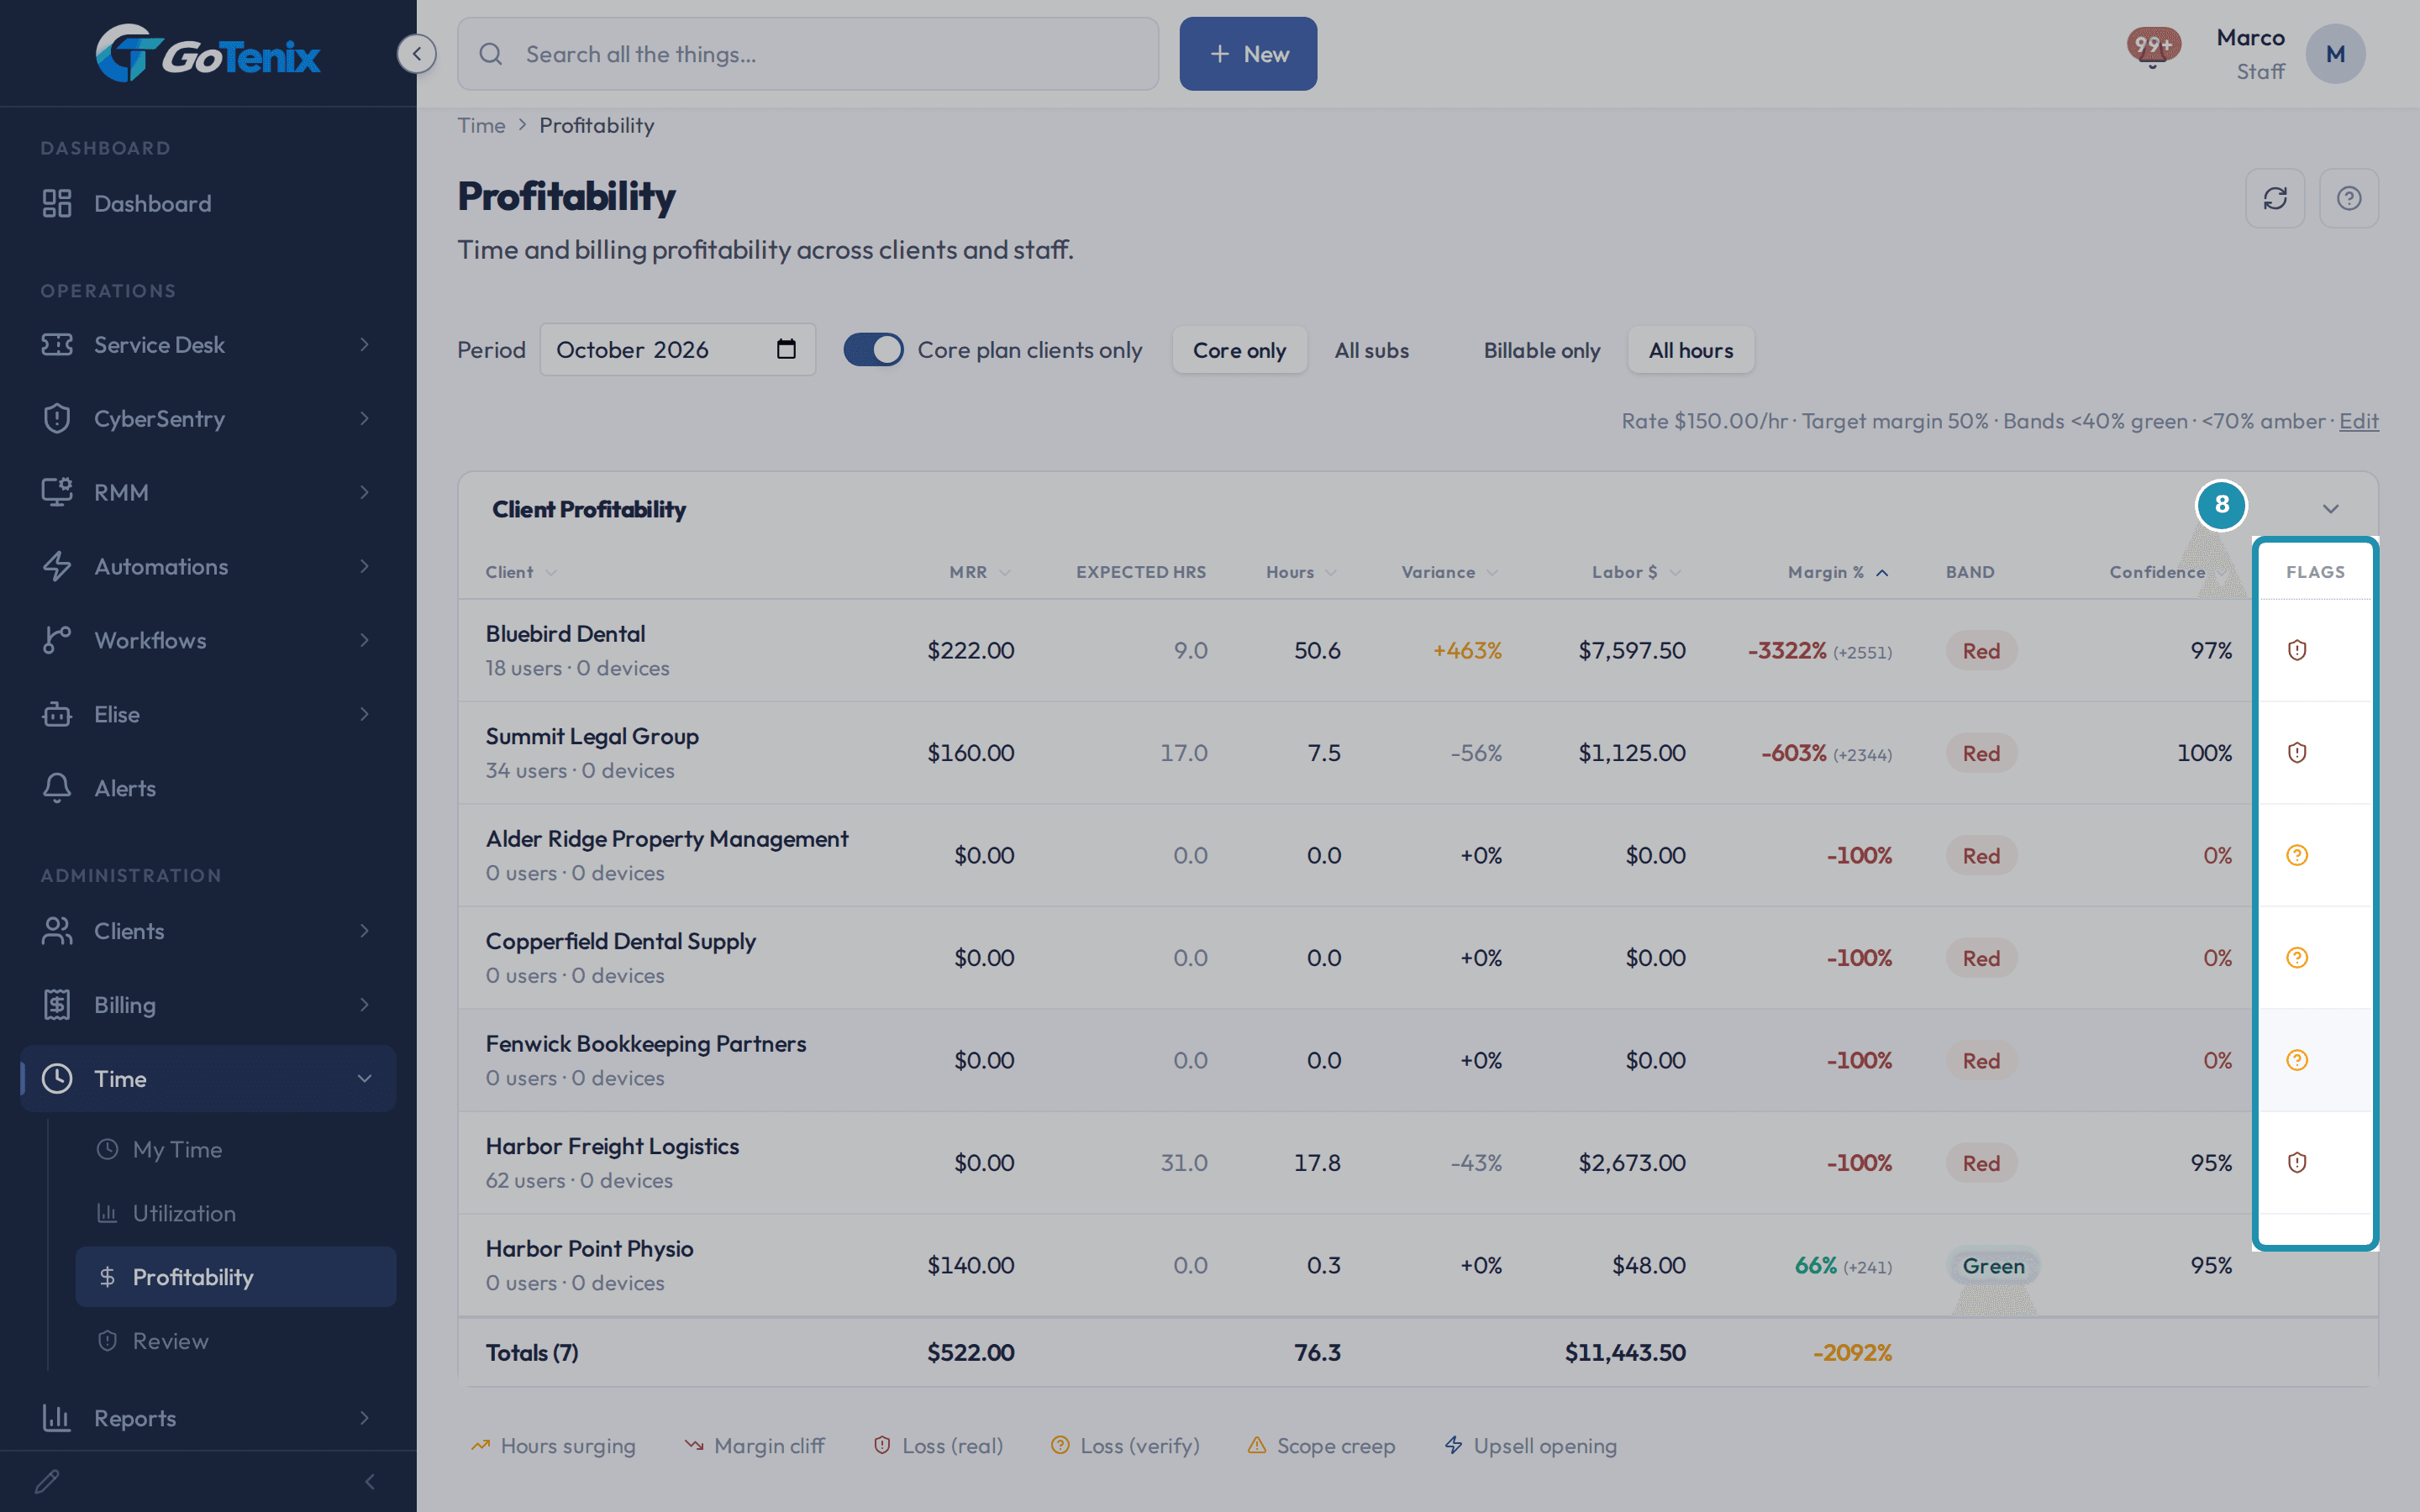
Under Time in the sidebar, click Profitability. Each client row shows MRR, Expected hrs, Hours, Variance, Labor, Margin %, Band, Confidence and Flags. Margin is MRR minus labor, as a percent of MRR. The worst margin comes first. The client costing you most is at the top. The Confidence number says how much of a client's hours were captured automatically.
Open the page that shows which client costs you money. Read the flags and pick the next move.
Loss (real) means a negative margin on mostly auto-captured hours. It is not a data problem, so have the pricing talk. Loss (verify) means a negative margin on mostly typed in hours. Fix time capture first. Scope creep means hours 50 percent or more over baseline with a healthy margin. Raise it at renewal. Upsell opening means hours 30 percent or more below baseline with a healthy margin. They need you less than expected, so offer more. Margin cliff means margin fell 20 points or more since last month. Hours surging means actual hours are above 1.4 times the trailing two month average. Something changed. A loss with confidence between 40 and 70 shows no loss flag. Check how its hours were captured before you decide.
Read the flags and pick the next move. Narrow the table when the numbers look off.
Core only and All subs choose which plans count as revenue. Billable only and All hours choose which hours count as labor. The Period field picks the month. The line of settings beside them (rate, target margin and band limits) has an Edit link to change the numbers that set the Green, Amber and Red bands.
If a client loses money on real hours, reprice.
Open the client's Billing tab to adjust their rates, net terms or tax treatment. A plan line can carry a second named rate with Pricing Tiers, and a client's Exemptions page can move named users or devices onto it or leave spare seats off the bill. Steps are in How to bill the right seat count and manage quotes.
If a client is a scope creep or upsell opening flag, plan the renewal talk.
Plan a renewal talk for Scope creep and Upsell opening clients.
If the bands or the cost look wrong, check the settings.
Go to Settings > Billing & Pricing > Profitability. It holds the Labor Rate ($/hr) and the two Expected Minutes fields. It also holds the Green Band, the Amber Band and the Target Margin. Labor Rate is one flat rate for the whole company. The settings guide below has the steps.
Or ask Elise for the same answers in chat.
Say "who is under 50% so far this week?" She reads the team report for the week. It has every tech's percentage against their target. Ask late in the week. Or ask "who was under 50% last week?". Say "how did the team do this week?" for the whole picture. Say "where did Alice's time go yesterday?" for one tech. Say "which client uses the most tech time?" for clients ranked by hours over the last 30 days, with billable hours beside it.
The pages behind each click
What you will have
- Find the techs who are under their hours target this week.
- Find the clients where the labor costs more than the plan brings in.
- Pick the next move for each: fix time capture, reprice, or open a renewal talk.
- Ask Elise the same questions in plain words.
- Read worked time and presence time without mixing them up.
Why it works this way: How to run a weekly profit check: who is under target and who loses money
A loss built on typed in hours is a data question. Fix it before it is a pricing talk.
Presence is shown beside worked time. It is never added into it. A busy looking day does not read as a productive one.
Nothing on these pages changes anything. You only look.
If it did not work: How to run a weekly profit check: who is under target and who loses money
- If the page says No Time Entries, nothing was logged for that period. Pick another period.
- If a client you expect is missing from Profitability, check the Period field. It shows one month at a time.
- You can see one page but not the other? Check your Billing permission first. The Profitability page needs it.
- If a client shows a loss with low Confidence, fix how the time is captured. Do that before you change the price.
Questions this page answers
How does time tracking work?
Time is tracked per-ticket via the timer widget or manual entry. The Time page shows all entries grouped by tech with ticket-level breakdown. Filter by date range to see utilization over different periods.
What does the confidence score on the profitability report mean?
Each client's margin number includes a confidence percentage: how much of the labor time was auto-captured (TIMER / PAGE_VIEW / AUTO_START) vs manually entered. A low confidence score means a margin problem could be a tracking problem, not a pricing problem. Use it to decide whether to fix capture or have a renewal conversation. Click Filter to choose which clients the report shows. Plan lists each Core plan held by clients you can see, plus Custom plan and No Core plan. Board lists the client boards you can see. A client shows if it matches any checked box. The report opens with every Core plan and Custom plan checked, so you see your Core plan clients. Clear unchecks them all and shows everyone. We remember your last choice for you, on this report only.
What is the difference between worked hours and presence on the Utilization report?
Total Hours counts actual work minutes. Passive presence, meaning idle time, breaks, and ambient page-view time captured while a tech simply had the app open, is shown separately as a "+ Nh presence" rider and is never added into worked hours (that double-count once let banked hours exceed the hours in the day). Expand a tech's By Client breakdown and each client chip shows worked hours first, then presence as "· Nh present". Worked time attributes to a client only through ticket-linked work, so the chips line up with the ticket list, while loose presence attributes to whatever org its slice carried. The Timer Tracked and Manual tiles still break the worked total down by how it was captured.
How does time reporting work?
The Time area's Utilization tab totals each tech's worked time over the period you pick, day, week, or month, stepped with the previous/next arrows, with a "By Client" toggle for the same totals grouped by client. Total Hours counts worked minutes only; passive presence (idle, breaks, ambient page-view time) rides alongside as a "+ Nh presence" figure and is never summed into worked time. Every tech on staff appears, even those who logged nothing. Staff means an active person with a permission group who is not blocked, so an account with no group, or a blocked one, shows only if it logged time in the period. In a week or a month, expected hours count only the working days up to today. Each row shows their working window ("start - end", or "active" while a timer runs) and a utilization percentage against expected hours (green at 80%+, amber at 50%+). A wall-clock timeline plots when each slice happened; the Timer Tracked and Manual tiles split the worked total by capture method. Expand a tech for per-client chips (worked "Nh" then "· Nh present") and an "Open full day view" drill-down into their full day.
What does the Utilization tab show for each tech?
In the default By-tech view every tech on staff gets a row, including anyone who logged nothing that period, so gaps stay visible. Staff means an active person with a permission group who is not blocked, so an account with no group, or a blocked one, shows only if it logged time in the period. Each row leads with the working window ("start - end", or "active" while a timer is still running) and a utilization percentage against expected hours per day, colored green at 80% or higher, amber at 50% or higher, and muted below. A wall-clock timeline strip plots when each slice actually happened, colored by bucket. Expand a tech and click "Open full day view" to open their full day on the My Time page; managers can view any tech this way, landing on a banner that names whose time you are viewing with a "Back to my time" link.
Was this helpful?